Usage of this site
This site allows you to browse through the archive of auroral observations made by all-sky imagers (ASIs) located on Svalbard and Andøya in the past years. Here we will give you a brief introduction into what the site offers specifically.
All content on the
"Data" page is dynamically created using JavaScript. If all you see is blank pages, you should check whether
JavaScript is enabled and if not,
enable it. You cannot browse the data without JavaScript.
Also, as a general rule, you should not use the browsers back button, as that will usually not work as expected! Instead, each page offers a link, usually toward the top, which allows you to return to the previous view of the data.
Choosing a date
The
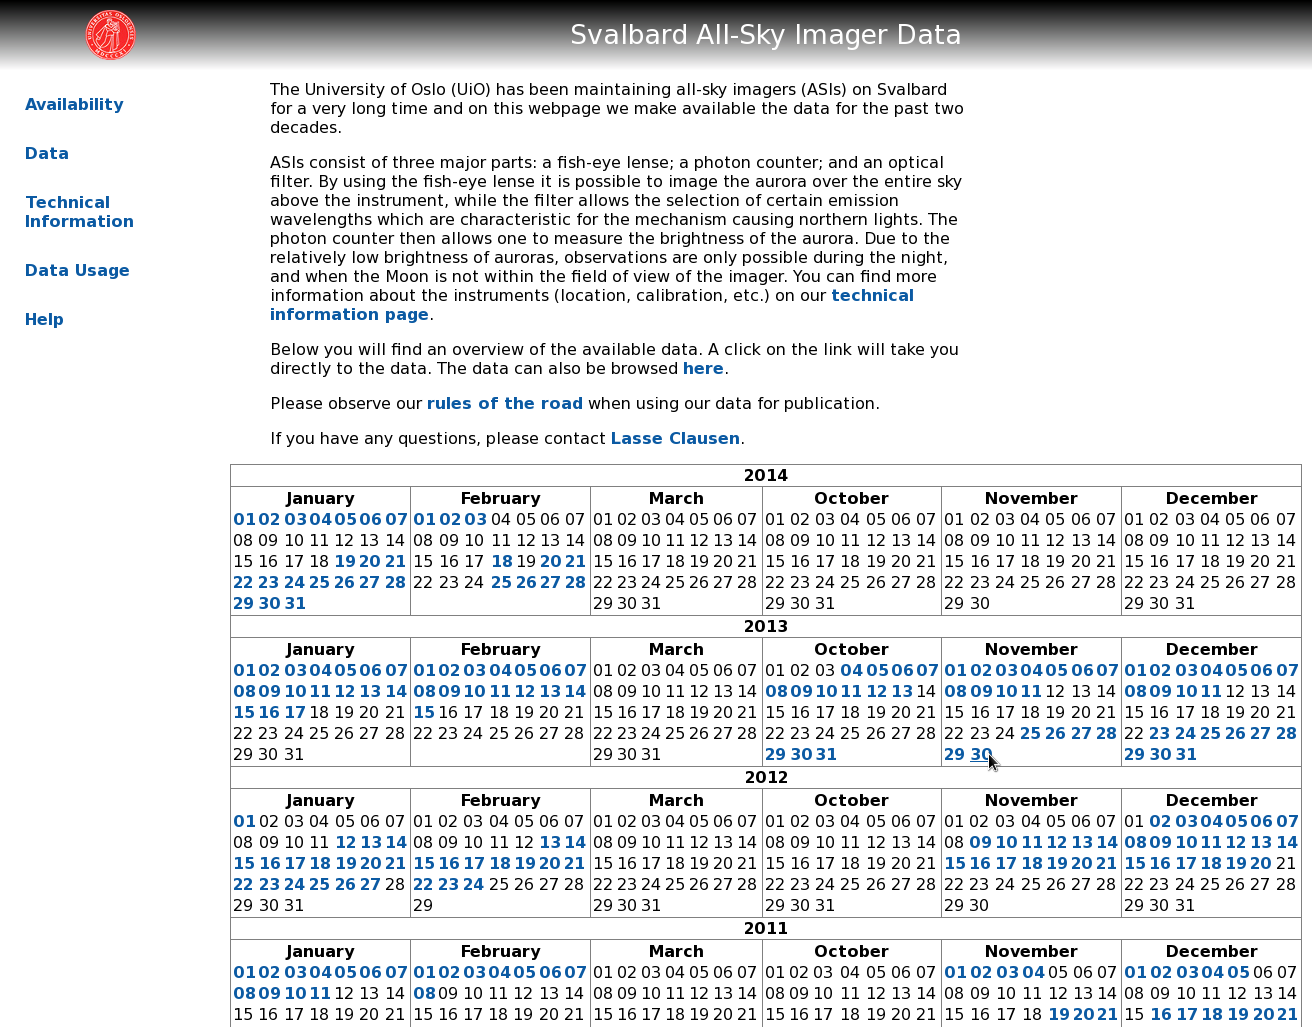
Availability page offers you an overview of the available data. For each year a calendar shows the dates in the months January, February, March, October, November, and December. Clickable dates (usually blue) indicate dates where data is available, if the date does not link to a keogram page, no data was collected on that day.
Suppose you are interested in data from 30 November 2013, clicking on the date will take you to the keogram page which shows you keograms of the three stations and the two wavelengths, where available.
to top
Keogram overview
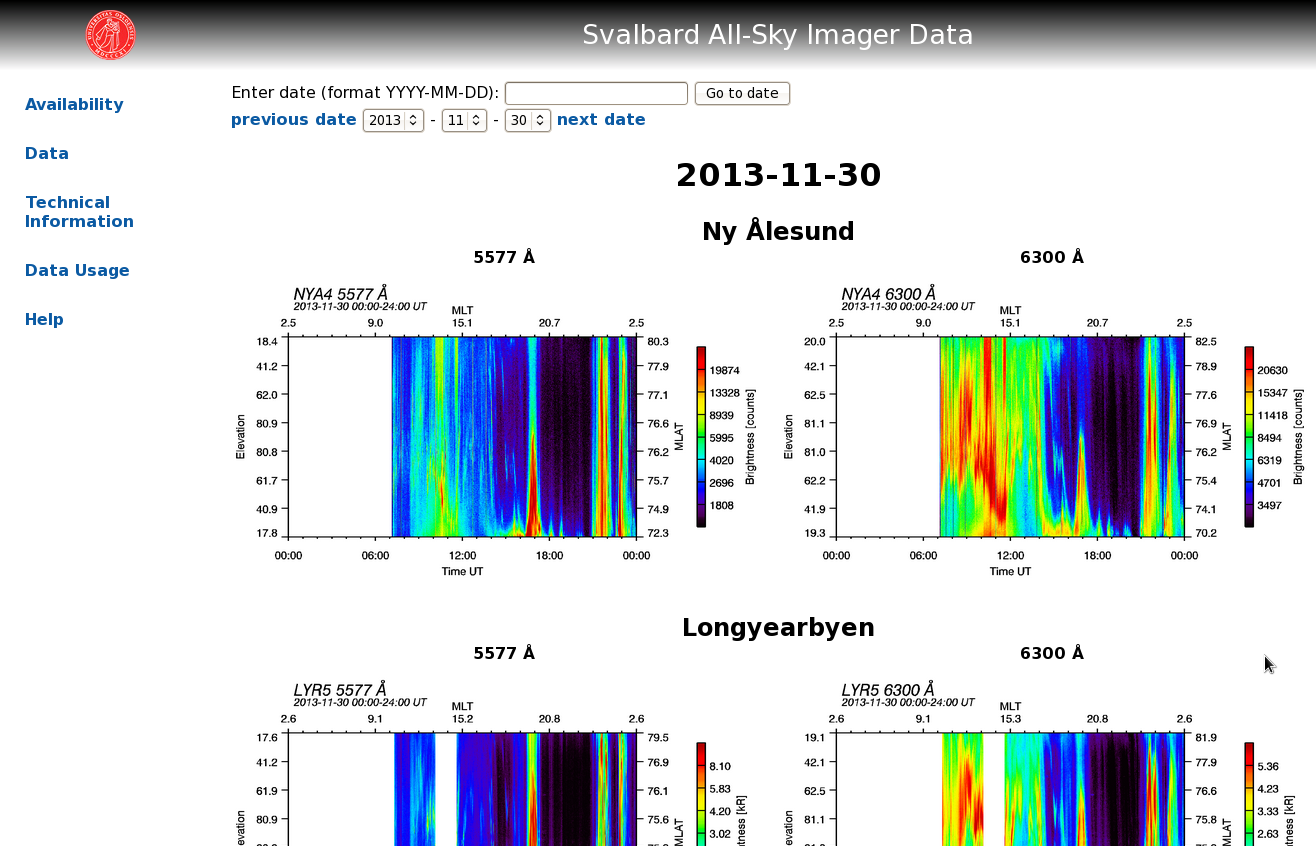
On the keogram overview page, there are several things to note:
- The text area in the top let's you jump to another date. Simply enter the date you are interested in (in YYYY-MM-DD format), click the button and you will, if data is available for that date, be taken to the keogram overview page of that date. If you click on the "Jump to date" button and nothing happens, then no data was collected on the date you entered.
- You can click on "previous date" and "next date" to jump to the keogram overview pages of the previous or next date when data when available.
- Using the drop down menus, you can select a date from the list. These menus only show you dates when data is available and are updated every time you change the year or the month.
to top
24 hour keograms
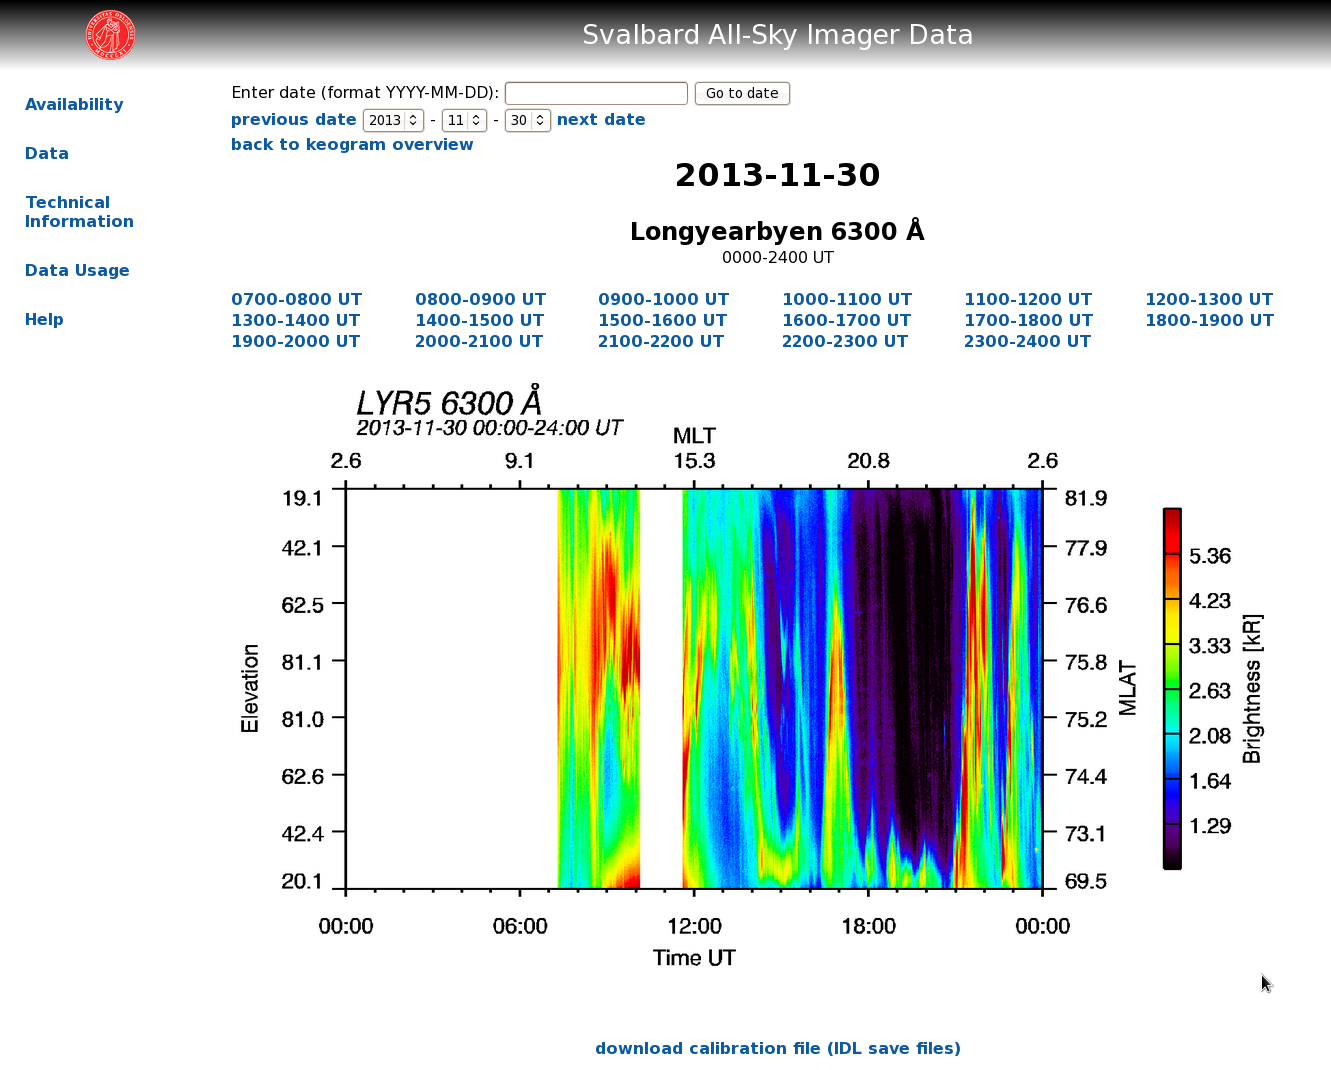
You can click on the individual keograms on the overview page to get a close up view. Above the enlarged keogram, just underneath the date drop-down menus, a link labeled "back to keogram overview" will appear. Clicking this link will take you back to the keogram overview page.
This site gives you access to the raw data files in PNG format. If you intend to download the data and do some of your own analysis, we are happy for you to do so as long as you observe the
rules of the road. To properly use the data, you need more information about each imager, which can be found in calibration files. You can at this stage download the calibration file for that date, ASI, and wavelength by clicking the "download calibration file (IDL save files)" link below the keogram. This IDL save file contains information like geographic/magnetic latitude and longitude of each pixel etc. More information about the calibration is found on the
"Technical Information" page.
As you are looking at the 24 hour keogram of the site and wavelength you selected, you might observe an interesting feature that you would like to inspect further. You can zoom in to 1 hour long keograms by clicking on one of the UT time ranges shown above the keogram.
For example, if you are interested in dayside cusp studies, you might want to have a look at the data between 0900 and 1000 UT, which is around magnetic noon for the Svalbard stations.
to top
1 hour keograms
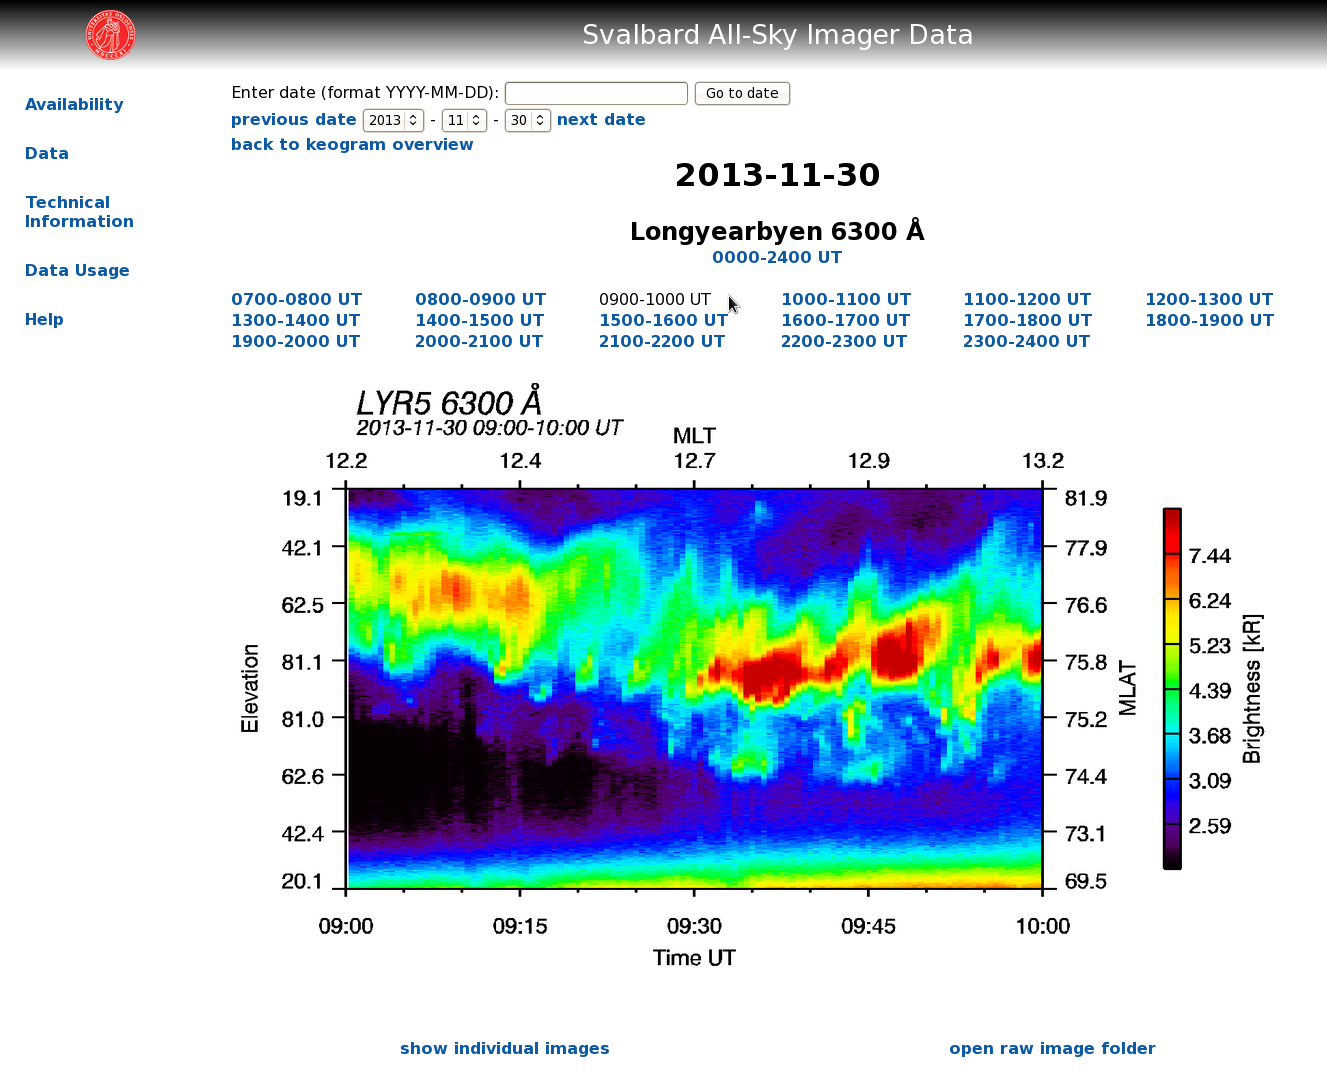
These images are 1 hour long keograms for the date, time, site, and wavelength you selected. You can return from this page to the keogram overview by clicking a link labeled "back to keogram overview", just underneath the date drop-down menus. You can also return to the 24 hour keogram by clicking on the "0000-2400 UT" link below the name of the site, above the 1 hour keogram. Or you can select another 1 hour time range by clicking on the time range link you are interested in.
Furthermore, you can
- show the individual ASI images for the entire 1 hour interval you selected by clicking on the link labeled "show individual images". After clicking on this link, a table of thumbnail images will appear below the keogram.
- open the folder on the server which contains the individual images in PNG format. This link opens in a new window/tab, and allows you to download the raw data for doing your on analysis on the data. Be sure to also get the calibration file as described above
Once you have clicked "show individual images" and the images are shown below the keogram, you can click on one of the individual images to have a closer look.
to top
Individual images
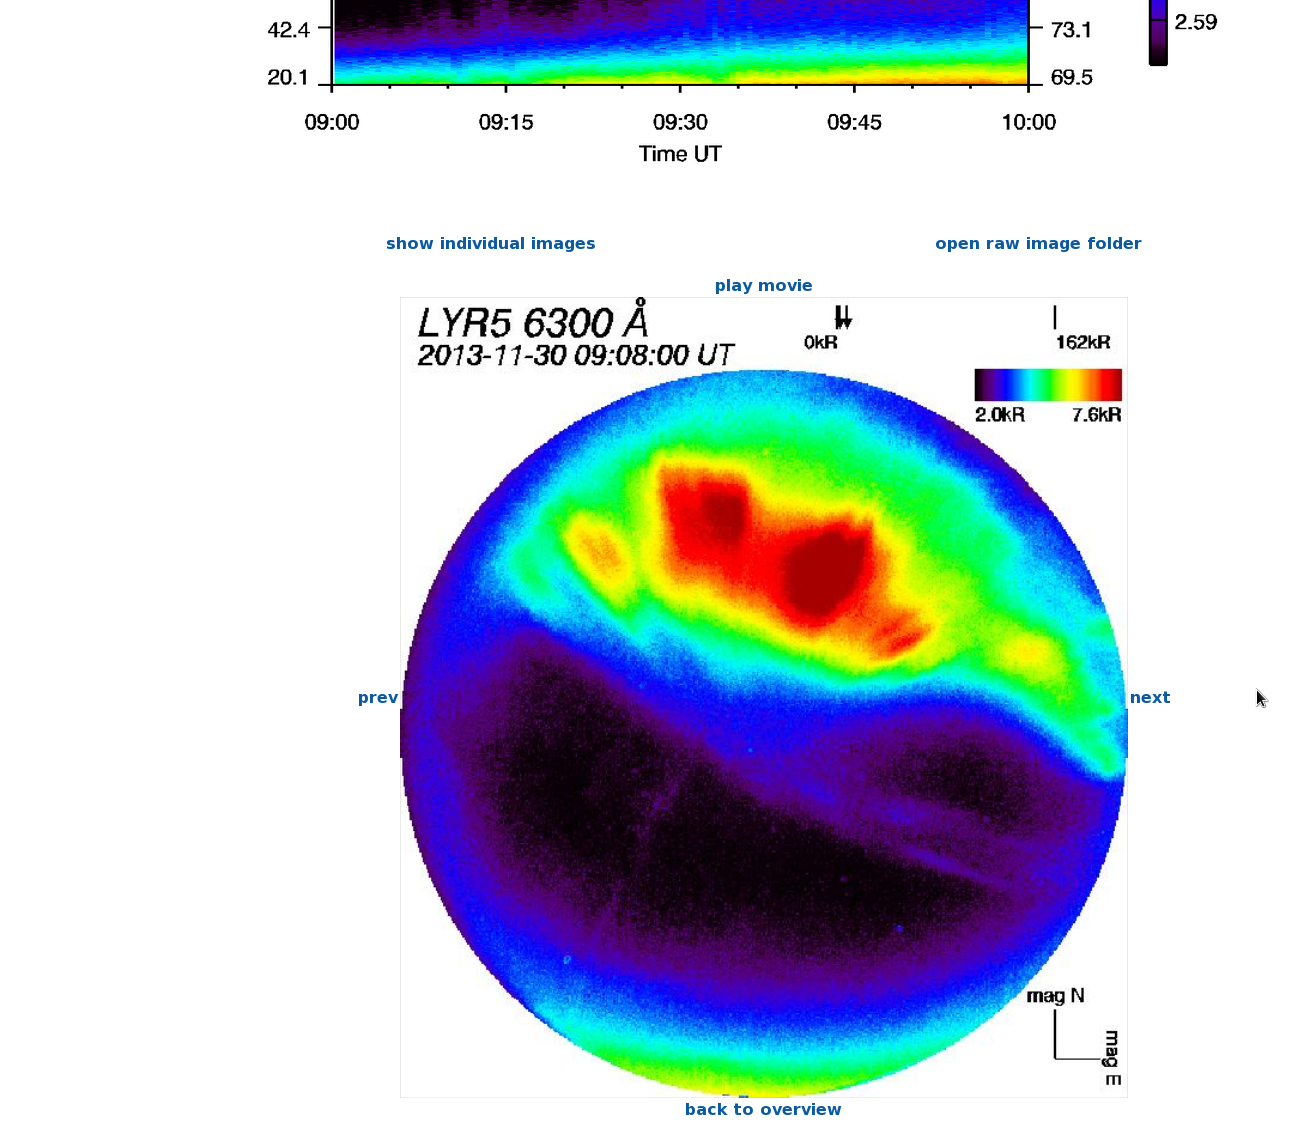
Clicking on one of the thumbnail images will bring you to this page, displaying the individual ASI image, underneath the keogram. These images are calibrated such that the up direction is along magnetic North, and magnetic East is to the right; these directions are indicated by two axes in the bottom right corner. In the top right corner you see a scale of the brightness. This scale is adjusted for each image individually, such that you need to be very careful when comparing brightness between images.
Below the individual image you get a link labeled "back to overview" which allows you to jump back to the overview of individual images for the entire hour. You can also step through the images by clicking the links labeled "prev" and "next" to the left and tight of the auroral image.
to top
Play movie
Above the individual image you will find a link labeled "play movie". Clicking it will do exactly that, i.e., automatically step through the individual images at a rate of 3 images per second. While the movie is playing, the link you clicked to start the movie changes label to "pause movie". Clicking it will pause the movie. Sometimes, you will need to click the "pause movie" link several times before it will do what it says on the box.
to top
Download data
You can download the calibrated images as PNG files by selecting the
1 hour keogram you are interested in and then click the link "open raw image folder" below the keogram. This will open a new browser window/tab from which the individual files can be downloaded. A calibration file containing the locations of each pixel and other parameters can be found when browsing the parent directory; the calibration file format is SITE_YYYYMMDD_WAVELENGTH_cal.dat and it is an IDL save file.
to top